퀀트 전략 알고리즘을 돌리기 위해서는 회사의 재무제표 데이터가 필요하다. 재무제표 데이터는 전자공시시스템인 DART, FnGuide, 네이버 증권 등에서 찾아볼 수 있다. 각각의 사이트마다 데이터를 표현하고 있는 방식들이 다르기 때문에 먼저 어떤 형식으로 가공되어 있는 데이터를 뽑아올 지 정해야 한다. 나는 먼저 데이터 양은 충분하되, 귀찮게 재가공할 필요가 없는 데이터를 뽑고 싶었다.
그래서 각각의 사이트에서 확인을 해 보았는데, 먼저 DART는 딱 봐도 귀찮은 작업들이 많을 것 같았다. CompanyGuide나 네이버 증권에는 재무 요약 표가 있는데, 이정도 데이터면 충분하다고 생각했다. 먼저 네이버 증권에 데이터가 좀 더 많아서 네이버 증권에서 크롤링 하는 코드를 만들었는데, 네이버 증권의 재무 데이터는 js로 불러오고 있기 때문에 브라우저를 통해서 크롤링이 가능하다. 그래서 좀 더 복잡하고 시간이 오래 걸리기 때문에 CompanyGuide에서 크롤링하는 코드를 다시 만들었다.
두 코드 모두 여기서 확인가능하다.
사용 도구
- Python 3.7
- Chrome Browser
데이터 원본
이 링크에서 확인 가능하다.
배경지식
BeautifulSoup
여기서 데이터 크롤링이라는 것은 html을 읽어와서 필요한 데이터만 추출해서 가공하는 것인데, bs4는 html에서 쉽게 오브젝트를 뽑아주도록 도와준다. 예를 들면,
soup = bs4.BeautifulSoup(html, 'html.parser')
soup.find_all('table')
위 코드로 html에서 table tag가 달린 오브젝트들을 모두 들고 올 수 있다. 자세한 내용은 검색하면 많이 나오니까 참고하면 된다.
삼성전자 데이터 크롤링
1. 데이터 형식 확인
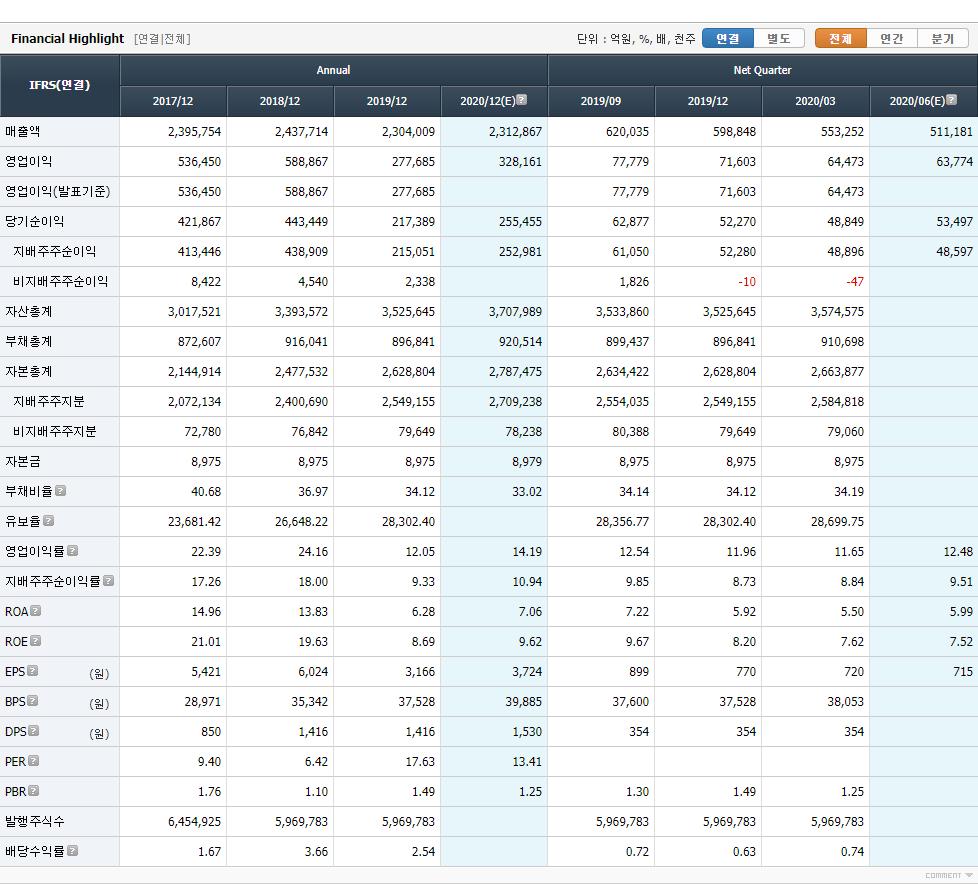
브라우저에서 F12를 누르면 개발자 도구를 열 수 있는데, 여기서 가져오고 싶은 데이터가 html에 어떤 방식으로 위치 해 있는지 확인할 수 있다.
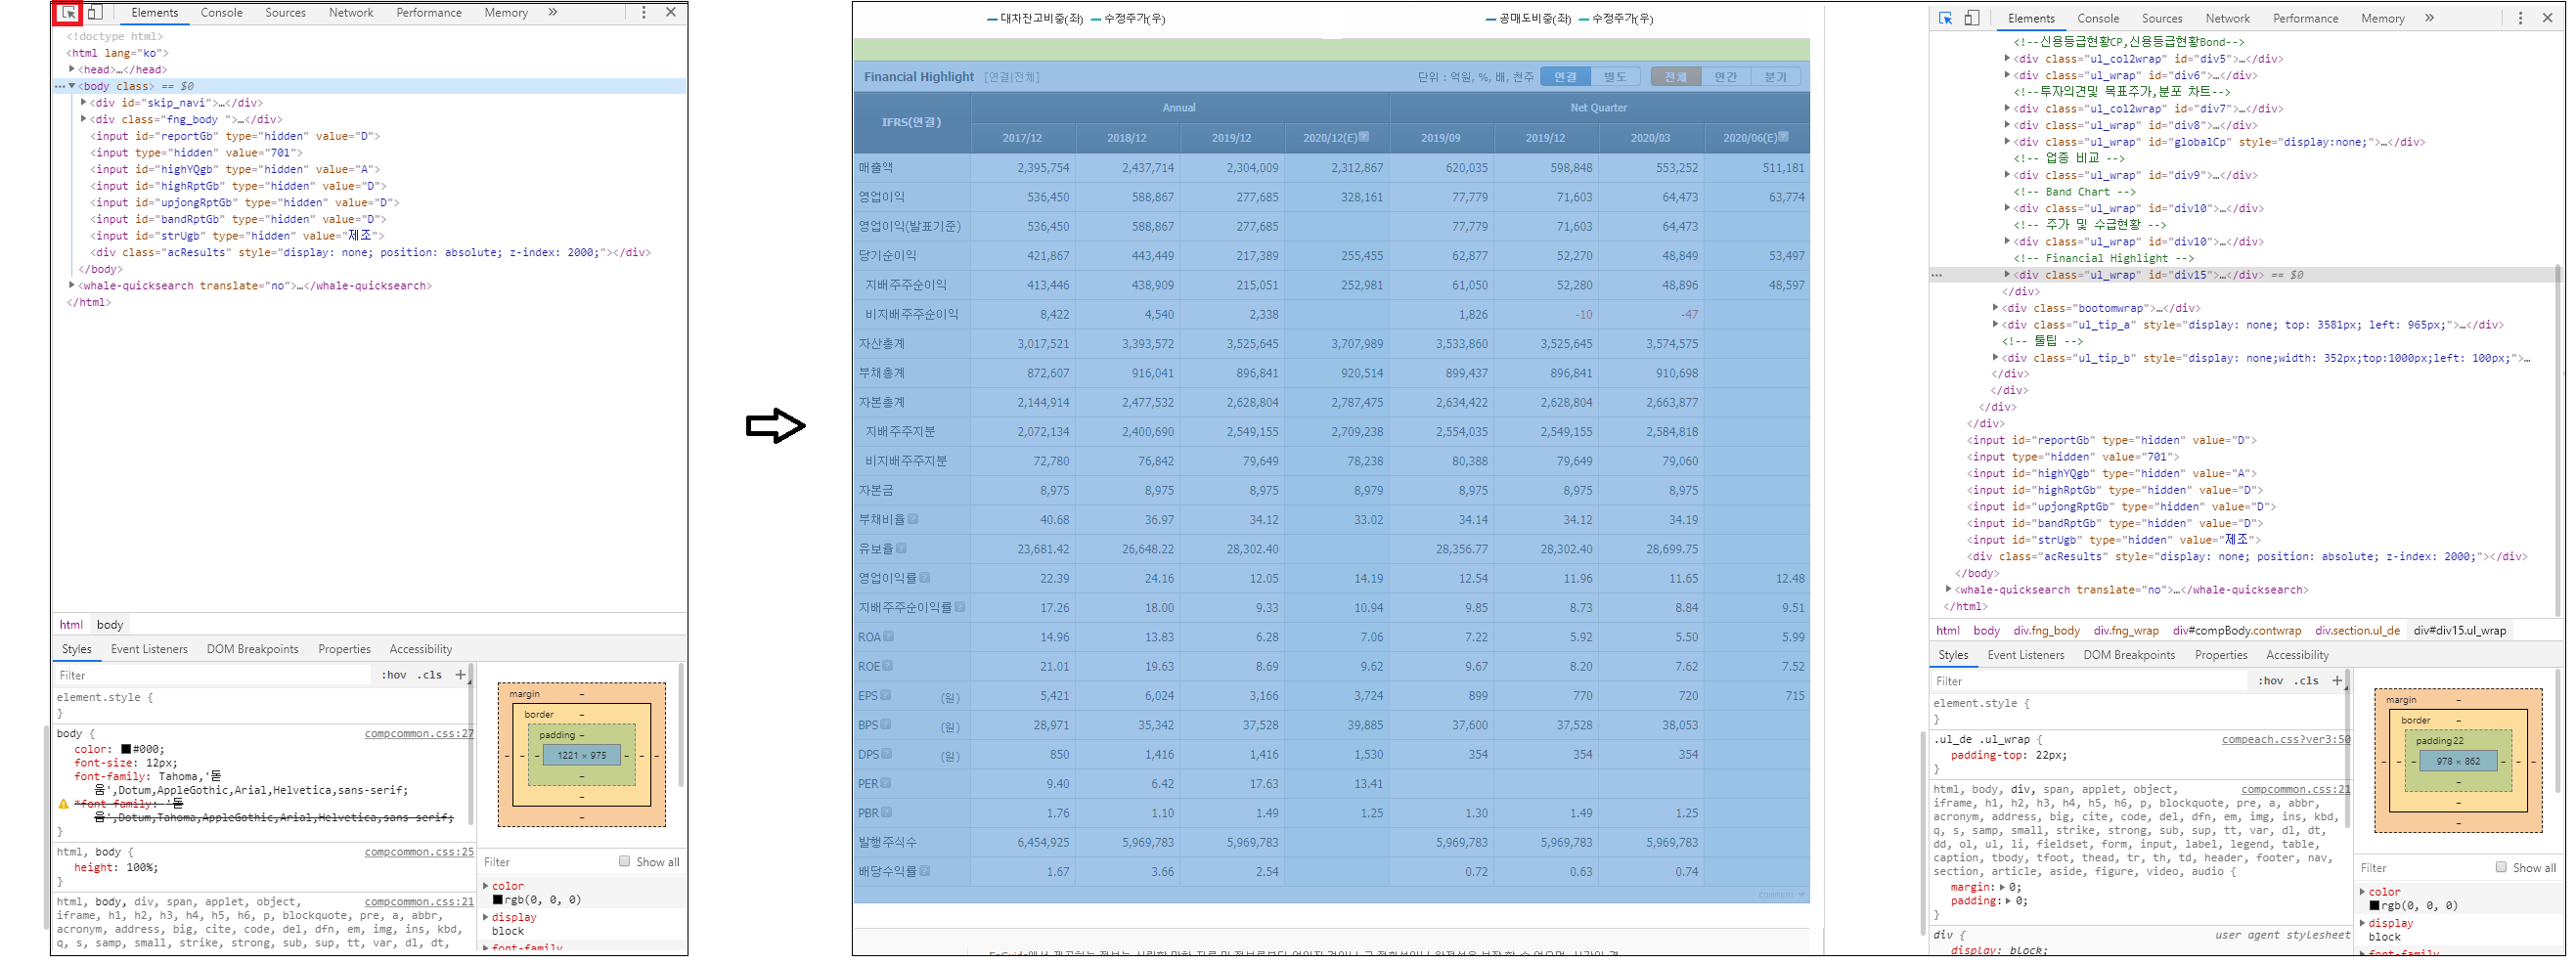
여기서 빨간색 네모를 누르면 영역을 선택할 수 있게 나오는데, 우리가 원하는 데이터인 표 영역을 누르면 오른쪽 개발자 도구에 html 코드 중 어디에 위치해 있는지 알 수 있다.
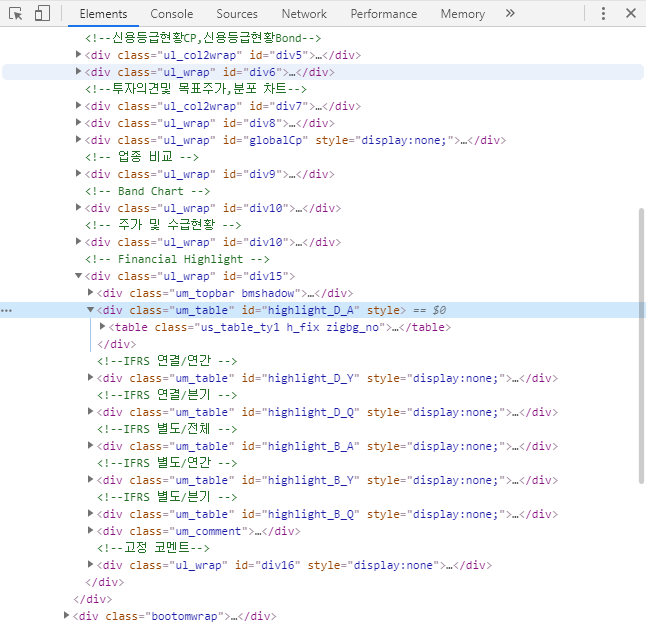
html 코드를 확인해 보면 <div class="um_table" id="highlight_D_A" style> 이 부분 밑에 있는 테이블이 우리가 원하는 데이터 임을 알 수 있다.
2. 구현
먼저 html을 읽어서 BeautifulSoup 오브젝트로 만들어 보자.
데이터가 들어있는 주소는 http://comp.fnguide.com/SVO2/ASP/SVD_Main.asp?pGB=1&gicode=A005930&cID=&MenuYn=Y&ReportGB=&NewMenuID=101&stkGb=701 이다.
url = "http://comp.fnguide.com/SVO2/ASP/SVD_Main.asp?pGB=1&gicode=A005930&cID=&MenuYn=Y&ReportGB=&NewMenuID=101&stkGb=701"
html = requests.get(url).text
soup = BeautifulSoup(html, 'html.parser')
전체 html을 BeautifulSoup로 만들었느니 여기서 재무 데이터에 해당되는 <table>을 가져오자. 앞서 확인했던 <div class="um_table" id="highlight_D_A" style>에서 id를 가지고 찾을 수 있다.
fin_info = soup.select('#highlight_D_A')[0]
id가 highlight_D_A인 오브젝트를 읽어와서 확인해 보면 대략 아래와 같이 나온다.
<div class="um_table" id="highlight_D_A" style="display:none;">
<table class="us_table_ty1 h_fix zigbg_no">
<caption class="cphidden">Financial Highlight</caption>
<colgroup>
<col style="width: 120px;"/>
<col span="8"/>
</colgroup>
<thead>
<tr class="th2row_f"><th class="clf tbold" rowspan="2" scope="col"><div>IFRS(연결)</div></th> <th colspan="4" scope="col"><div>Annual</div></th> <th colspan="4" scope="col"><div>Net Quarter</div></th> </tr><tr class="td_gapcolor2">
<th scope="col"><div>2017/12</div></th>
<th scope="col"><div>2018/12</div></th>

...

</thead>
<tbody>
<tr><th class="clf" scope="row"><div>매출액</div></th><td class="r">1,162</td> <td class="r">1,287</td> <td class="r">1,483</td> <td class="r tdbg_b"> </td> <td class="r">336</td> <td class="r">363</td> <td class="r">456</td> <td class="r tdbg_b cle"> </td> </tr>
<tr><th class="clf" scope="row"><div>영업이익</div></th><td class="r">127</td> <td class="r">182</td> <td class="r">237</td> <td class="r tdbg_b"> </td> <td class="r">46</td> <td class="r">54</td> <td class="r">93</td>
<td class="r tdbg_b cle"> </td> </tr>

...
우리는 위의 데이터를 DataFrame으로 만들어야 하기 때문에, row 데이터, column 데이터, 그리고 각 값들을 뽑아 오면 된다.
먼저 column 데이터를 뽑아보자. 위의 데이터에서 column 데이터는 2017/12 같은 날짜 데이터이다. 이 데이터들은 <thead> 안의 <th> 태그 안에 들어있기 때문에 아래와 같은 코드로 구할 수 있다.
col_data = [item.get_text() if len(item.get_text()) == 7 else item.get_text()[-12:-5] for item in fin_info.select('thead th')]
col_index = th_data[3:13]
['2017/12', '2018/12', '2019/12', '2020/12', '2019/06', '2019/09', '2019/12', '2020/03']
중간 중간 형식이 달라서 코드가 깔끔하지 않지만 위 코드로 아래와 같이 데이터를 뽑을 수 있다.
다음으로 row 데이터도 비슷하게 뽑을 수 있다. row 데이터는 <tbody> 안의 <th> 태그 안에 들어있다.
row_index = [item.find('dt').get_text().strip() if item.dt else item.get_text().strip() for item in fin_info.select('tbody th')]
['매출액', '영업이익', '영업이익(발표기준)', '당기순이익', '지배주주순이익', '비지배주주순이익', '자산총계', '부채총계', '자본총계', '지배주주지분', '비지배주주지분', '자본금', '부채비율(%)', '유보율(%)', '영업이익률(%)', '지배주주 귀속순이익률(%)', 'ROA(%)', 'ROE(%)', 'EPS(원)', 'BPS(원)', 'DPS(원)', 'PER(배)', 'PBR(배)', '발행주식수', '배당수익률(%)']
마찬가지로 항목마다 형식이 조금씩 다르기 때문에 잘 바꿔야한다.
다음으로는 실제 항목 값들을 들고와 보자.
fin_data = [item.get_text().strip() for item in fin_info.select('td')]
fin_data = np.array(fin_data)
fin_data.resize(len(row_index), len(col_index))
데이터를 들고와서 numpy array 형식으로 저장해 주었다.
마지막으로 DataFrame으로 만들면 된다.
fin_df = pd.DataFrame(data=fin_data[0:,0:], index=row_index, columns=col_index)
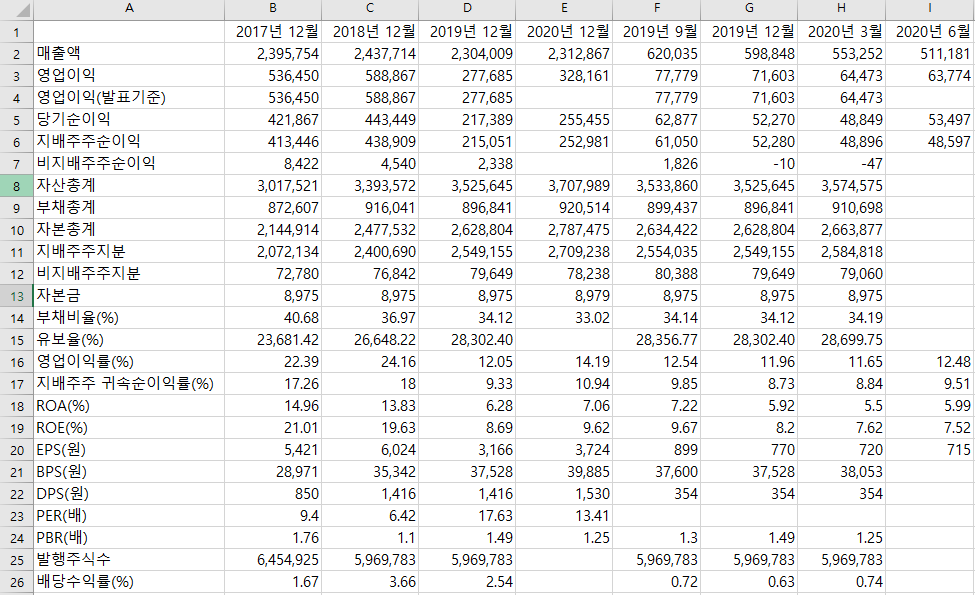
그럼 최종적으로 아래와 같은 데이터를 얻을 수 있다.
               2017/12 2018/12   2019/12 2020/12 2019/06 2019/09   2019/12 2020/03
매출액              1,162   1,287     1,483             336     363       456
영업이익               127     182       237              46      54        93
영업이익(발표기준)         127     182       237              46      54        93

...

발행주식수           13,536  13,536    13,536          13,536  13,536    13,536
배당수익률(%)          0.51    0.47      0.48                              0.48
3. 전체 코드
import pandas as pd
import requests
import bs4
import numpy as np

url = "http://comp.fnguide.com/SVO2/ASP/SVD_Main.asp?pGB=1&gicode=A079940&cID=&MenuYn=Y&ReportGB=&NewMenuID=101&stkGb=701"

fs_info = requests.get(url).text
bs = bs4.BeautifulSoup(fs_info, 'html.parser')
fin_info = bs.select('#highlight_D_A')[0]

row_data = [item.get_text() if len(item.get_text()) == 7 else item.get_text()[-12:-5] for item in fin_info.select('thead th')]

col_index = row_data[3:13]
row_index = [item.find('dt').get_text().strip() if item.dt else item.get_text().strip() for item in fin_info.select('tbody th')]

fin_data = [item.get_text().strip() for item in fin_info.select('td')]
fin_data = np.array(fin_data)
fin_data.resize(len(row_index), len(col_index))

fin_df = pd.DataFrame(data=fin_data[0:,0:], index=row_index, columns=col_index)
모든 종목 데이터 크롤링
모든 종목에 대해 데이터 크롤링을 하려면 위의 코드를 함수화 하고 각 종목에 대해서 함수를 돌리면 된다. 그러려면 먼저 모든 종목 코드가 필요하다. 종목 코드는 여기서 구할 수 있다.
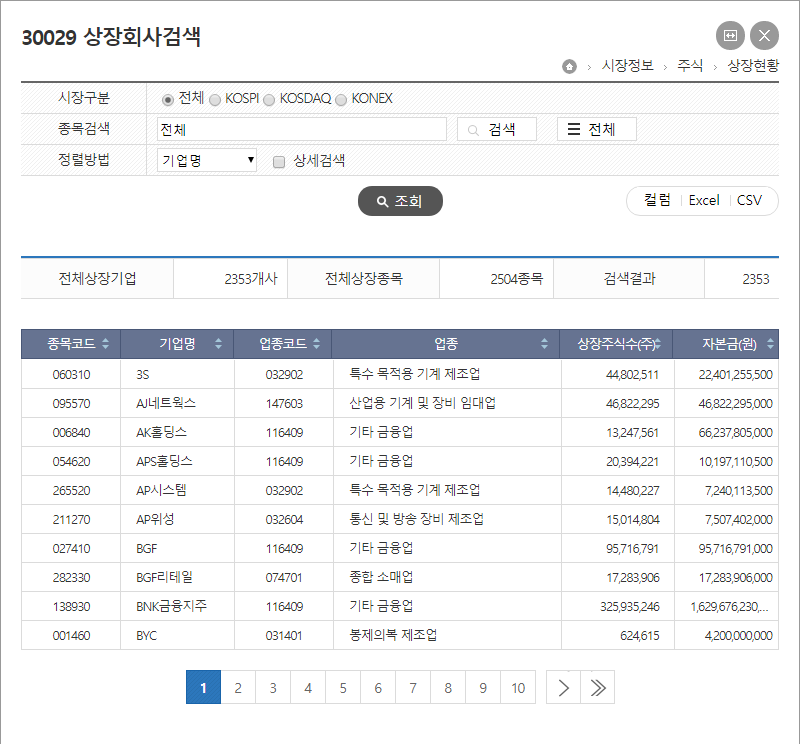
위 페이지에서 CSV 파일로 다운받으면 된다. 파일 이름을 data.csv로 지정 했다면, 아래 코드로 종목코드를 읽을 수 있다.
firm_datas = pd.read_excel('data.csv')
firm_datas = firm_datas[["종목코드", "기업명", "업종코드", "상장주식수(주)"]]
firm_datas["종목코드"] = firm_datas["종목코드"].apply(lambda code: 'A' + '0'*(6-len(str(code))) + str(code))
파일에 저장되어있는 코드와 CompanyGuide 링크로 사용할 종목 코드 형식이 다르기 때문에 apply함수로 수정해주어야 한다.
전체 코드
전체 코드는 깃허브에 올려놓았다. 링크
결과 화면